The Luxury Reset: Toronto Detached Prices Slip 7.6% as the GTA's $1M+ Market Pauses
The GTA's million-dollar market did not stop in September, but it slowed. Of 5,040 homes sold, 1,822 closed at $1 million or more, 36.2% of all sales. That is a touch below the 38.0% share for the year to date, and it came with the sharpest detached price decline in the 416 on this month's report.
The broader market was in what TRREB called a holding pattern. Sales fell 9.0% to 5,040, new listings dropped 14.4% to 16,500, and the average selling price was $1,006,409, down 5.1%. This is the luxury read on those numbers: where the high end is trading, what moved, and what it means if you are buying or selling above $1 million.
The $1M+ Market at a Glance
- $1M and above: 1,822 sales, 36.2% of the GTA total (year to date: 38.0%)
- $1.5M and above: 645 sales, 12.8% of the total
- $2M and above: 275 sales, 5.5% of the total (year to date: 5.7%)
- $1M to $1.25M: 721 sales, the single busiest price band in the whole GTA market
- $1.25M to $1.5M: 456 sales
- $1.5M to $2M: 370 sales (242 from $1.5M to $1.75M, 128 from $1.75M to $2M)
The shape matters. Sales thin out steadily as price rises, and the steepest drop-off comes above $1.5 million. The $1M to $1.25M band is where most luxury buyers are actually shopping, and it is the band that registered more sales than any other price range in the GTA this September.
Luxury Detached: Where the High End Lives
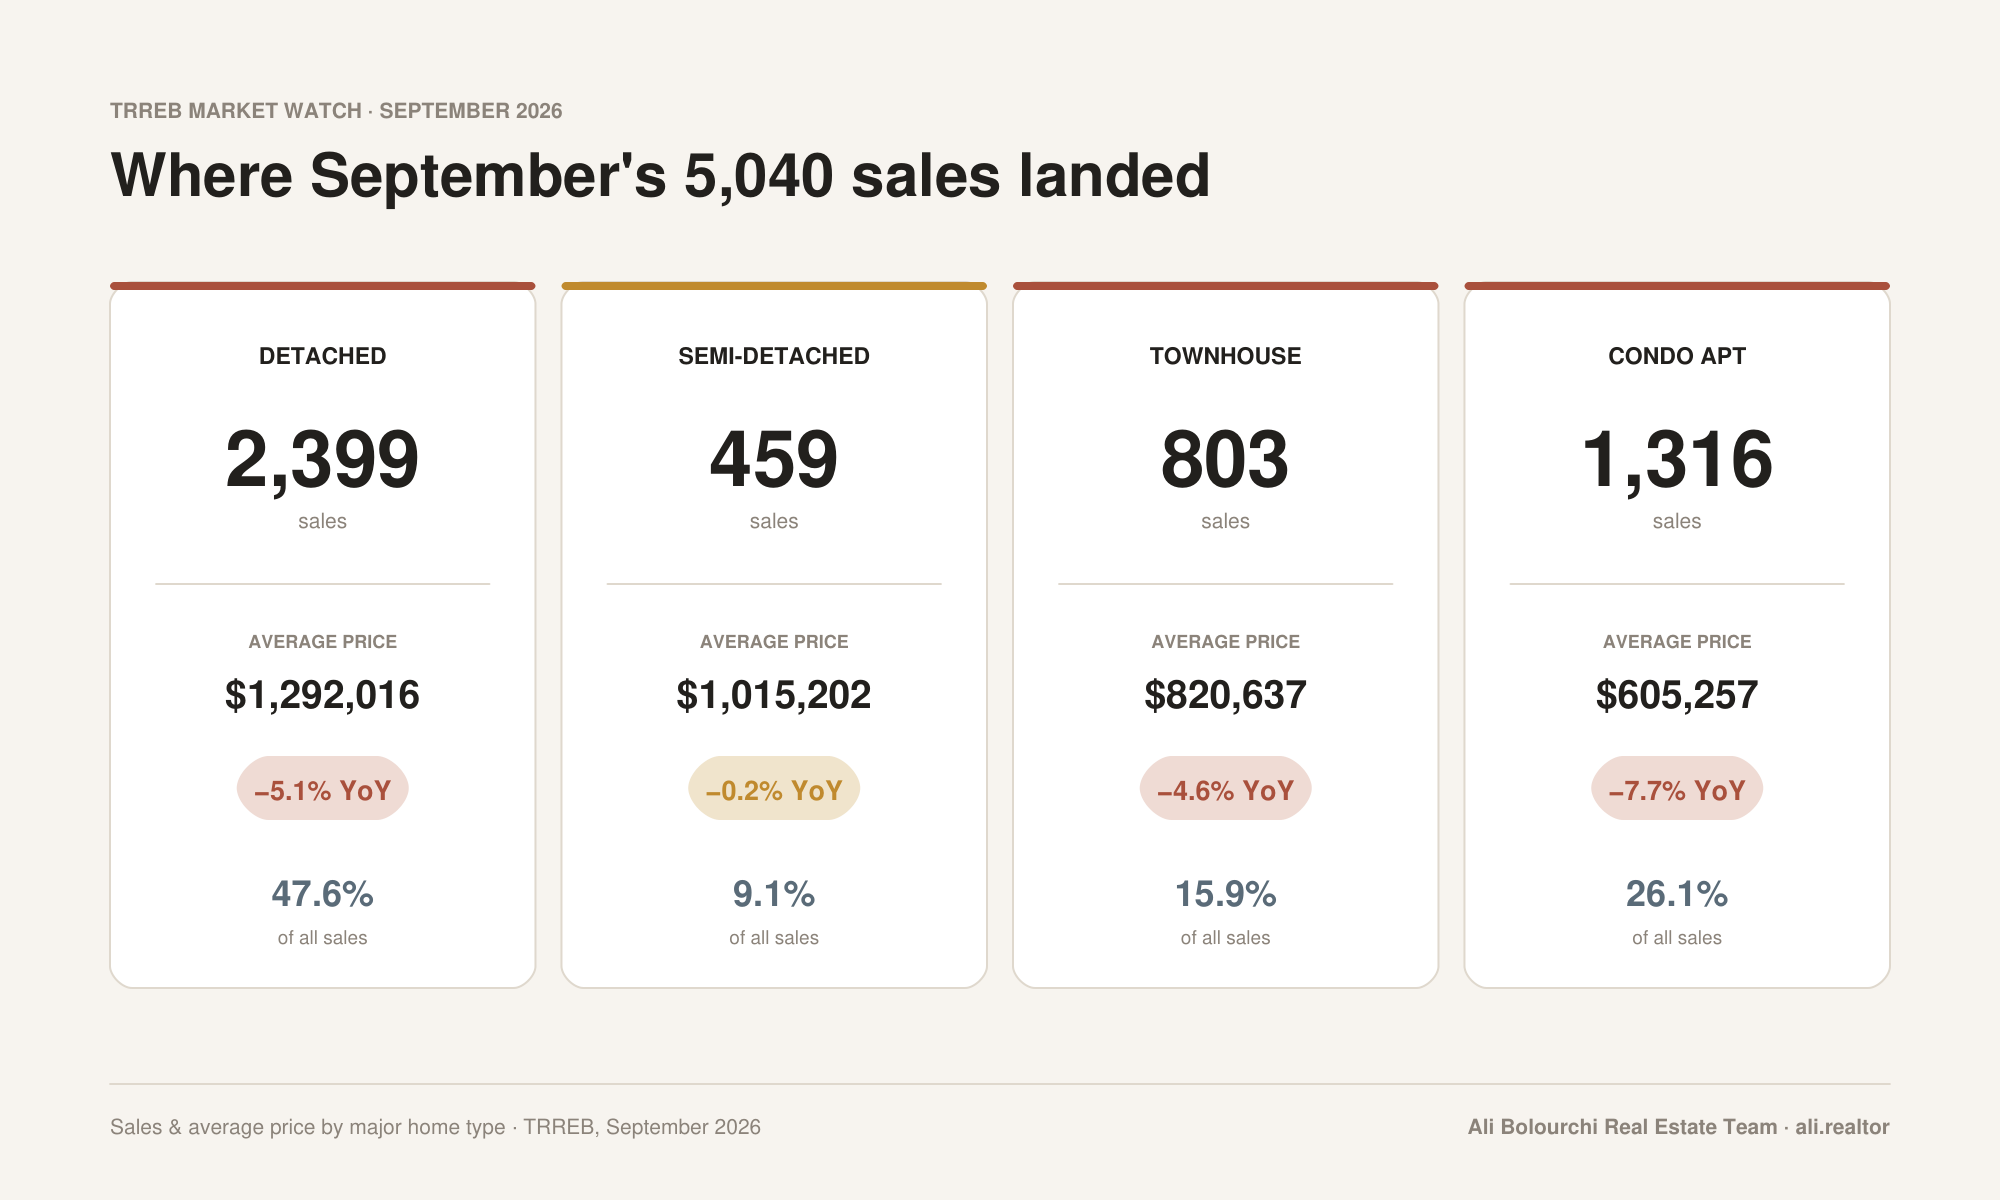
Detached homes were 2,399 of the month's sales, 47.6% of the market, at an average of $1,292,016 (down 5.1%). And they are the luxury product: 1,415 of those detached sales, 59.0%, closed at $1 million or more. Of the 275 sales above $2 million, 238 were detached homes.
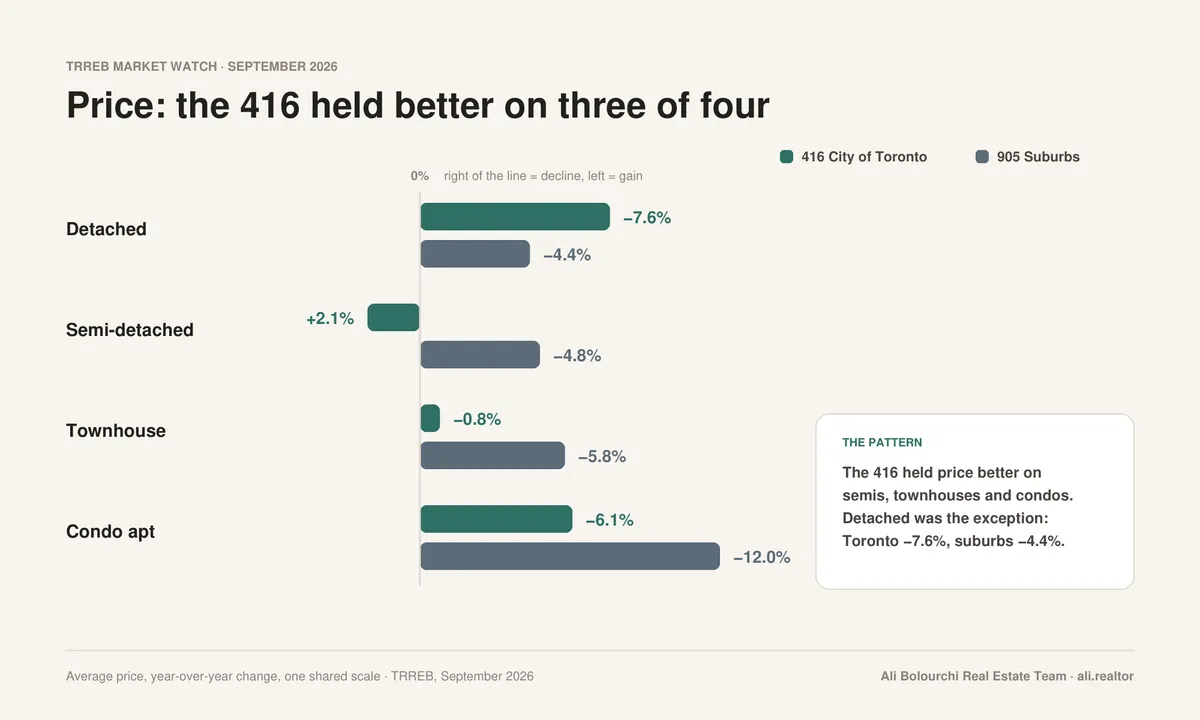
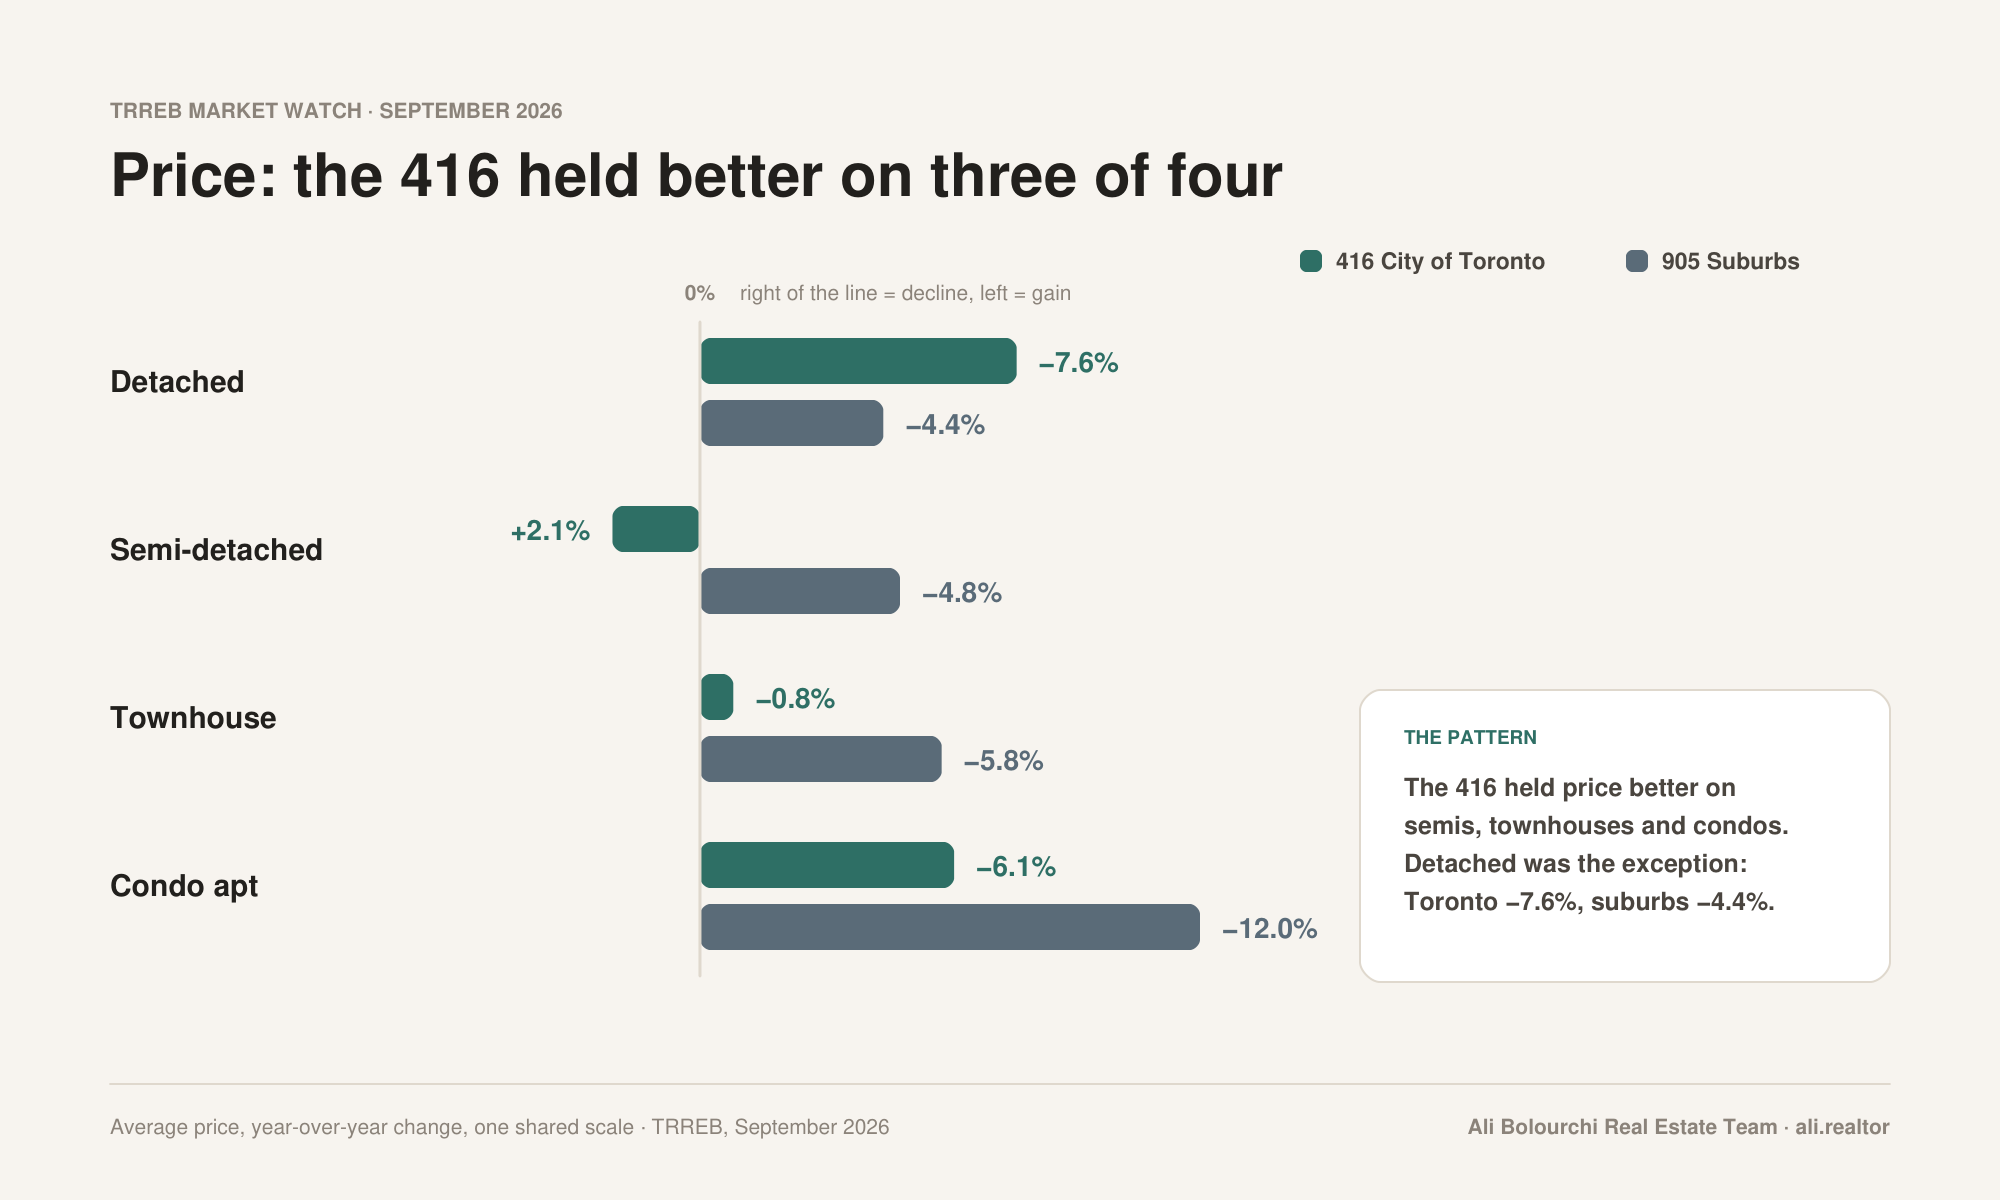
- City of Toronto (416): 640 detached sales, down 4.0%. Average price $1,562,966, down 7.6%
- Suburbs (905): 1,759 detached sales, down 10.3%. Average price $1,193,432, down 4.4%
- Detached at $2M and above: 238 sales, 9.9% of all detached sales (year to date: 10.9%)
Insight: In July and August we wrote that Toronto detached prices were holding up best, down just 1.5% in July and 0.1% in August. That has reversed on price: the 416 average fell 7.6% in September, well above the 905's 4.4% decline. On sales, the city still held up better than the suburbs. Because the 416 average includes every detached sale, not only luxury ones, treat this as a signal that high-end Toronto sellers are making concessions to keep deals moving, not as a verdict on any one street.
Pockets of the Luxury Map
A few regions on the report show what pricing power looks like above the GTA average.
- Oakville: 162 sales at an average of $1,365,169, with 4.9 months of inventory and homes selling for 96% of list
- King: 20 sales at an average of $1,875,750, but 11.4 months of inventory and 94% of list. Ample choice for buyers
- Toronto Central: 924 sales at an average of $1,102,955, the busiest part of the city, with 5.1 months of inventory
The contrast between Oakville and King is the point. Inventory and pace vary enormously inside the luxury segment, and a GTA average hides it. King buyers have time and room to negotiate. Oakville buyers have less of both.
The Economic Backdrop
Real GDP grew 3.3% in the second quarter on an annualized basis, Toronto employment grew 1.7% in August, and inflation ran at 3.0%. The Bank of Canada overnight rate is 2.3% and mortgage rates sit at 5.49% for 1 year, 6.05% for 3 years and 6.09% for 5 years.
TRREB Chief Information Officer Jason Mercer said buyers are waiting on confidence, not intent: "We know there is substantial pent-up demand in the GTA, with many households fully intending on purchasing a home in the months ahead. These would-be homebuyers want to take advantage of today's more affordable housing market, but they need to be confident that their employment situation will remain solid and inflation will not put pressure on borrowing costs over the long term."
TRREB President Daniel Steinfeld pointed to the municipal election: the decisions the next mayors and councillors make "on affordability, housing supply and the costs associated with buying a home can also influence buyer demand and confidence in the market." And CEO John DiMichele urged governments to reduce barriers "such as Toronto's Municipal Land Transfer Tax and opposing its expansion across the GTA and Simcoe County." For luxury buyers, that tax is not abstract. It scales with price.
What This Means for You
If You're Buying
This is a buyer's moment at the high end, not a distressed one. Average prices are down 5.1% year over year and homes across the GTA are closing at an average of 98% of list. Toronto detached prices are down 7.6%. Take your time, compare carefully, and negotiate. The caution: supply is also shrinking (new listings are down 14.4%), so a good home in the right pocket will not wait forever if confidence returns.
If You're Selling
Above $1 million, buyers are deliberate and the pool narrows with every step up in price. Only 275 homes sold above $2 million across the whole GTA this month. Price to the current market, present the home at its best, and expect to be negotiated with.
If You're Investing
Luxury is a patient play. Prices are softer than a year ago, and Toronto detached has repriced meaningfully. If you are building a long-term position in prime GTA property, September's data supports negotiating hard and being selective, rather than waiting for a single bottom call.
Considering a move at the top of the market?
Luxury pricing is specific to the street, the home and the buyer pool. Let's look at your property or your search with numbers built for your situation.
Ali Bolourchi Real Estate Team
Phone: 416-886-2000
Email: [email protected]
Websites: GTALuxuryHomes.ca | ali.realtor | The4Sale.com
Source: Toronto Regional Real Estate Board (TRREB) Market Watch, September 2026. Price-band figures are from page 2 and regional figures from page 3 of the report, for all property types unless stated. Year-to-date shares are calculated from the report's year-to-date price-range table. 'Luxury' here means sales at $1 million and above; averages by property type include all price points. This article is for information purposes only and is not intended to solicit buyers or sellers currently under contract with a brokerage.